
FIFO or weighted average: why the same stock gives different margins
A business buys 100 identical units at £10 each, then another 100 at £14. After both deliveries, it sells 150 for £20 each and counts the remaining 50. The physical stock and sales are the same, but FIFO produces £1,300 gross profit while periodic weighted average produces £1,200. In this hypothetical example, the £100 profit difference sits entirely in closing inventory. Under UK-adopted IAS 2, the cost formula decides that allocation before the separate test of net realisable value.
Check which inventory the formula covers
IAS 2 paragraphs 23 and 24 require specific identification for items that are not ordinarily interchangeable and goods or services produced and segregated for specific projects. That approach traces individual costs to particular items. It is inappropriate for large numbers of ordinarily interchangeable items where selecting which costs remain could predetermine profit.
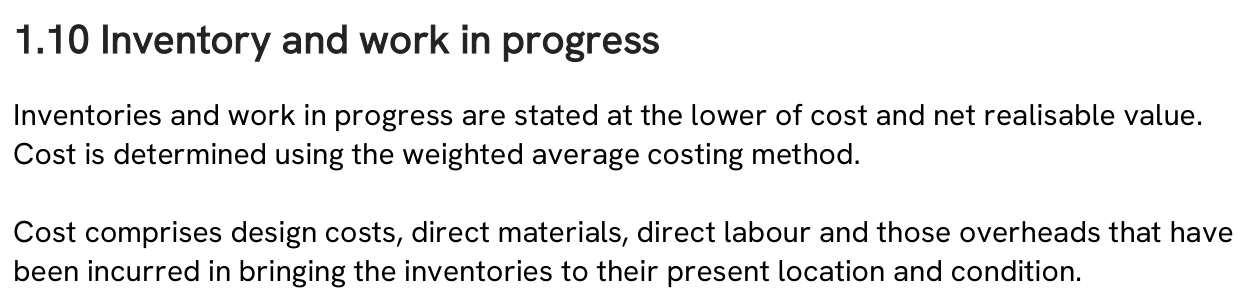
For inventory outside that specific-identification category, paragraph 25 requires FIFO or weighted average. Use the same formula for inventories with a similar nature and use to the entity. A different nature or use can justify a different formula; geographic location or different tax rules alone cannot.
This article covers ordinarily interchangeable inventory under UK-adopted full IFRS. It does not cover a US GAAP LIFO policy or decide tax treatment. First confirm the reporting framework and the inventory category, then check the approved formula.
Sources and context, checked :
Divide the £2,400 available cost
Assume there is no opening stock, all 200 units are interchangeable and every sale occurs after both receipts. The £10 and £14 amounts are complete IAS 2 unit costs. There are no other costs, taxes, returns or shortages, and net realisable value exceeds cost under both formulas. The average below is periodic weighted average.
The first receipt costs £1,000 and the second £1,400, giving 200 units with £2,400 available cost. FIFO assigns the earliest costs to the units sold. Cost of sales is 100 × £10 plus 50 × £14, or £1,700. The 50 remaining units carry the latest £14 cost, or £700.
Weighted average divides £2,400 by 200 units, giving £12 per unit. Cost of sales is 150 × £12 = £1,800 and closing stock is 50 × £12 = £600. Weight the prices by quantities; a simple average of supplier prices would fail when the batches contain different numbers of units.
| Measure | FIFO | Periodic weighted average |
|---|---|---|
| Available inventory cost | £2,400 | £2,400 |
| Cost of 150 units sold | £1,700 | £1,800 |
| Cost of 50 units remaining | £700 | £600 |
| Sales, 150 × £20 | £3,000 | £3,000 |
| Gross profit | £1,300 | £1,200 |
Sources and context, checked :
The profit difference has a matching stock difference
Both columns reconcile to £2,400 of available cost. FIFO reports £100 less cost of sales and £100 more closing inventory in these facts. It has not created cash or reduced the supplier bills. The higher profit follows from which receipt costs are treated as sold.
On the FIFO basis, the cost entry is Dr cost of sales £1,700; Cr inventory £1,700. On the weighted-average alternative, it is Dr cost of sales £1,800; Cr inventory £1,800. These are alternative treatments for comparison, not two entries to post together. IAS 2 paragraph 34 recognises the carrying amount as an expense in the period when the related revenue is recognised.
FIFO does not always produce higher profit. Here purchase costs rise. Different cost movements and transaction timing can change the direction or size of the difference. The formula allocates costs and does not itself direct warehouse staff to pick the oldest physical units.
Sources and context, checked :
Check when the software recalculates the average
Paragraph 27 permits a weighted average calculated periodically or after each additional shipment, depending on the circumstances. Those methods can produce different results when sales occur between receipts. In this example, all sales happen after both receipts, so periodic and moving average happen to agree.
A month-end spreadsheet using total receipts cannot, by itself, validate a system that recalculates the average after each receipt. Read the transaction sequence, including issue dates, and reproduce the method the records are meant to use.
Ordnance Survey's 2025/26 accounts provide a published example of a weighted-average inventory policy. That is the company's reported policy, not a requirement for every IAS 2 reporter.
Prove cost first, then assess recovery
Reconcile opening inventory cost plus receipt cost to cost of sales plus closing inventory, with any other movements explained. Check the receipt quantities and complete costs, transaction dates and configured method against the approved policy. Differences between locations need a reason grounded in nature or use, rather than location alone.
IAS 2 paragraph 9 still requires the lower of cost and net realisable value. Once cost is established, assess that separate limit. Do not switch the formula to reach a preferred margin; a proposed accounting policy change needs its own IAS 8 assessment.
Sources and context, checked :